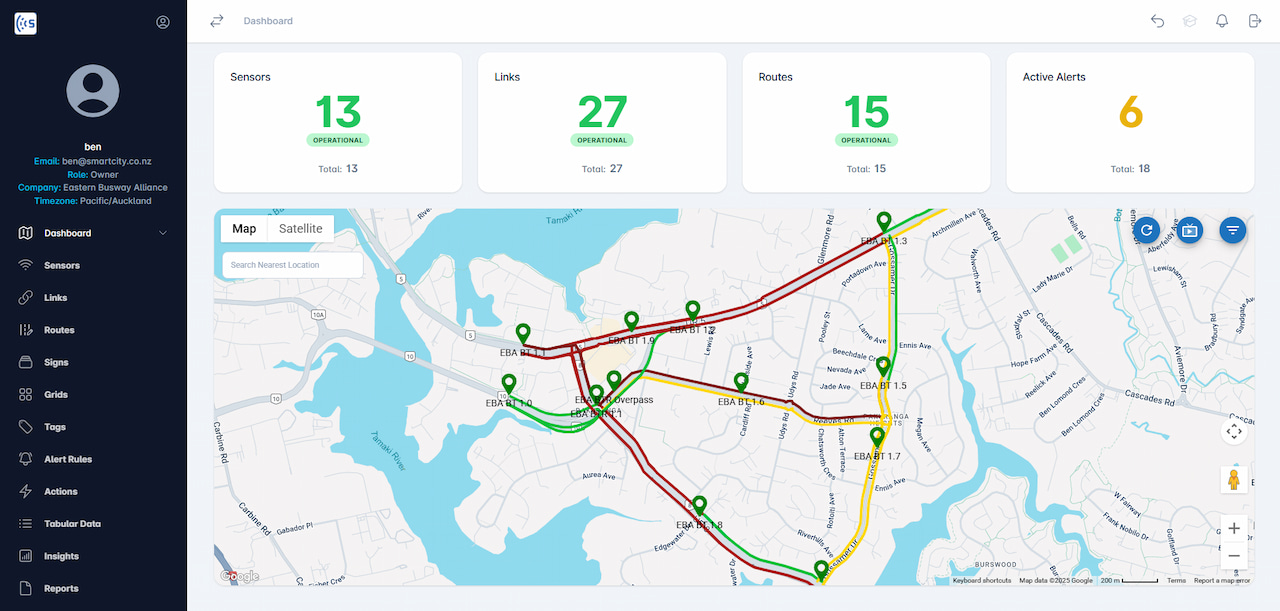
Contact

SmartTraf: Real-time data for solving transport challenges

Contact us
Products / Transport Management / SmartTraf
Traffic congestion is an issue not just in New Zealand’s bigger cities; inefficient transport systems and lack of actionable data have until now hindered urban mobility and added to increasing consumer frustration.
Realtime actionable insights
Realtime Transport Monitoring provides actionable insights that reduce congestion, improve traffic flow, and tightens road safety. By collecting and analysing transport data, city leaders can make informed decisions to optimise urban mobility.
The difference between buses and cars
Smart City’s solution uses Bluetooth-enabled sensors to monitor vehicle speeds, travel times, and congestion patterns in real time. The system offers traffic classification, distinguishing between cars, buses, and motorbikes. The data integrates into dashboards for quick analysis, helping cities respond proactively to traffic issues.
Accuracy assured
Smart City’s transport monitoring solutions deliver accurate, real-time insights to improve urban mobility, reduce congestion, and strengthen public safety.
Realtime data transforms transport
The Eastern Busway Alliance implemented this technology to provide real-time travel times, resulting in increased public transport uptake and reduced congestion during major roadworks.
About us
Request our white paper on improving your city’s transport systems with real-time monitoring

This field is for validation purposes and should be left unchanged.

SmartTraf.
Real-time overview of transport performance, implement remedies.

SmartTraf is a cutting-edge system combining sophisticated hardware and market-leading cloud-based software to offer a comprehensive, real-time overview of transport performance. It includes real-time travel-time metrics, vehicle statistics, and historical analysis, making it arguably the most accurate and informative transport planning tool available in Australasia.

Trucks

12

Buses

7

Passenger Cars

148

Motorbikes

22

Cyclists

16

Pedestrians

23

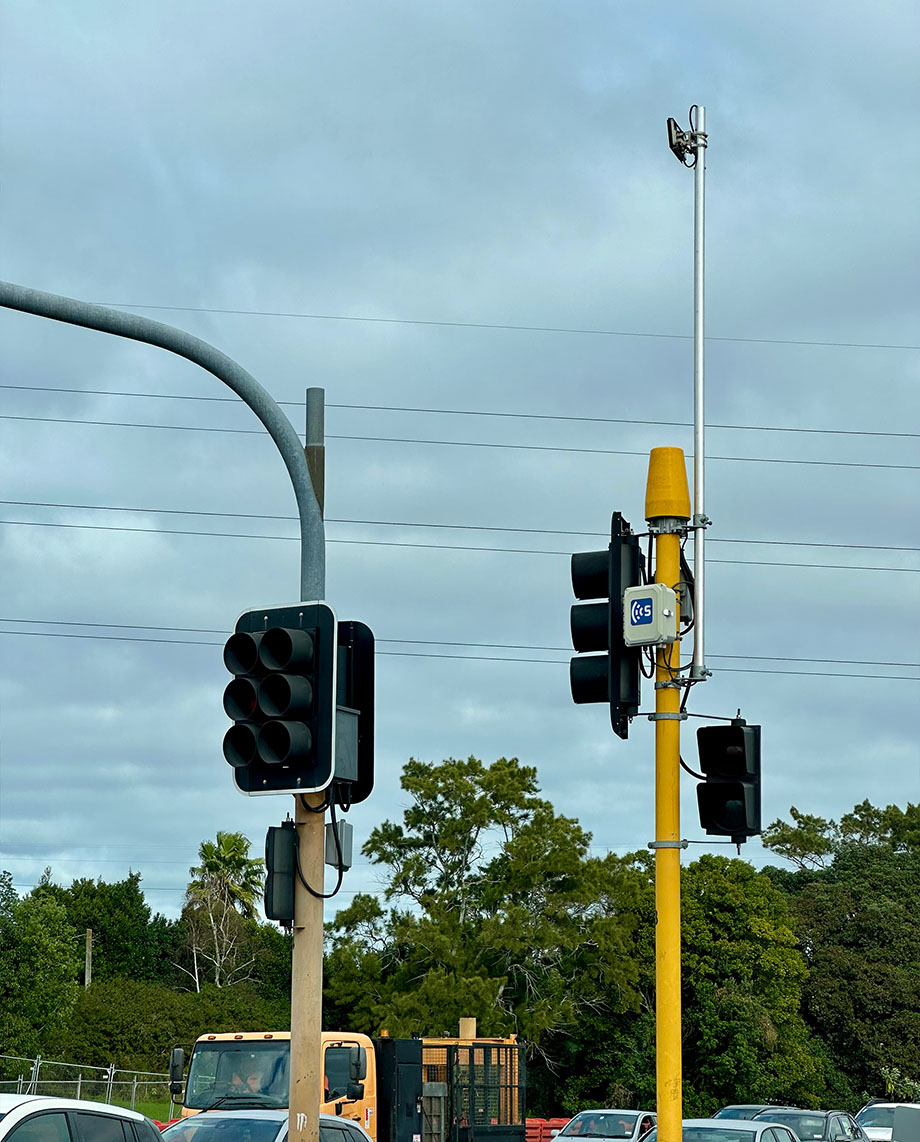
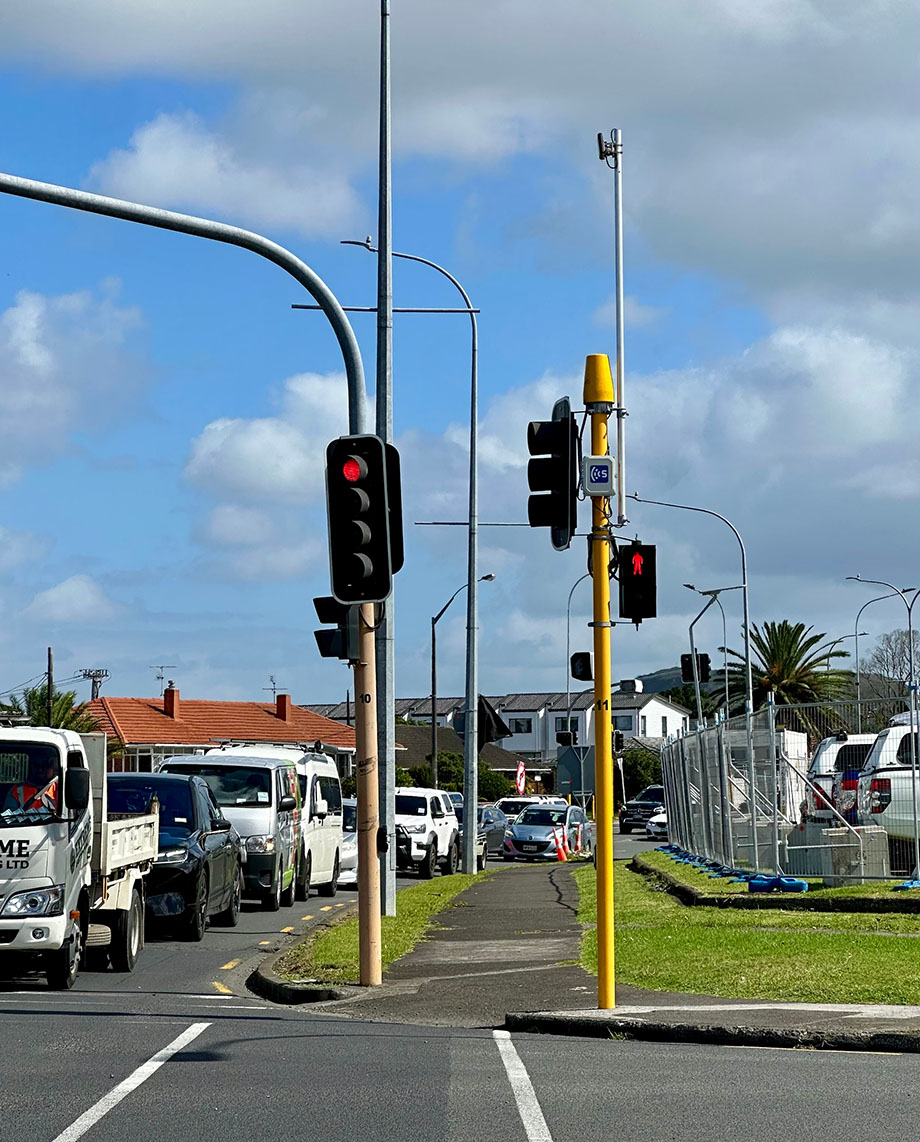
Contact us to learn how we can improve your city’s transport systems with real-time monitoring.

Contact us

Collect & analyse traffic data in real time

The system identifies Bluetooth and Wi-Fi signals from devices like smartphones and tablets via their unique MAC addresses. By tracking these addresses, SmartTraf can monitor individual movement patterns, whether they’re drivers or passengers.

This data assists traffic engineers in monitoring traffic flow, pinpointing congested areas, assessing construction impacts, and displaying dynamic traffic data on road signs.

SmartTraf Features

SmartTraf is an advanced hardware and cloud-based traffic data analytics tool for Road Controlling Authorities. It provides all the Departments–including Transport Operation, Engineering, and Planning–accurate and robust traffic information for better management of traffic congestion.
Alerts on Radar Data
Get email notifications on volume, occupancy, stopped vehicle, speed, and queue length; changes in real-time based on static thresholds or historical traffic patterns.
Real-Time Data
Radar data is synced to SmartTraf’s iNode in realtime for prompt creation to traffic status and decision-making.
Visualisation of Historical Data
Get data visualisations through SmartTraf’s iNode for before and after studies and comparisons of traffic trends over weeks or months.
Open API
iNode™ fully documented REST API makes integration with other systems seamless.

End-to-end solution integrates roadside sensors with edge computing power and cloud-based software

During construction, the TrafficXHub and smartmicro solution continues to capture travel-time across pre-established routes, the volume of multi-modal traffic, vehicle volume by lane, vehicle classification, point speeds by lane, turning movement volumes, and headway and gap data.

Both historical and real-time data can be accessed on SMATS' data analytics platform, iNode, which not only processes and displays the data but also provides visualizations for before and
after comparisons, real-time alerts, as well as customizable dashboards and report templates.
Contact us for a consultation and tailored solution.
Contact
27 Million

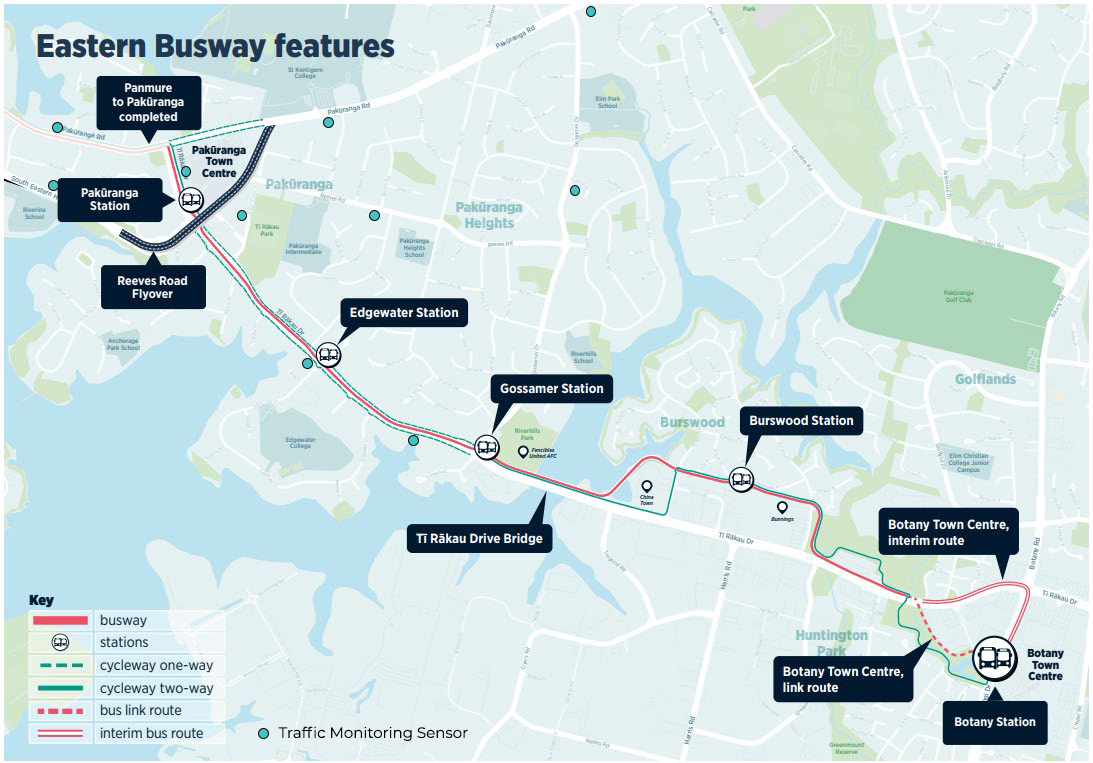
trips monitored over a 36 month period.
*Estimate based on average daily trips.