SmartVMS is our next-generation variable message signage system, redefining how real-time travel information is communicated on New Zealand roads.
Developed by Smart City NZ, this industry-first innovation empowers motorists with live multi-modal journey times — comparing car, bus, and train routes side-by-side — to support smarter, faster, and more sustainable travel decisions.
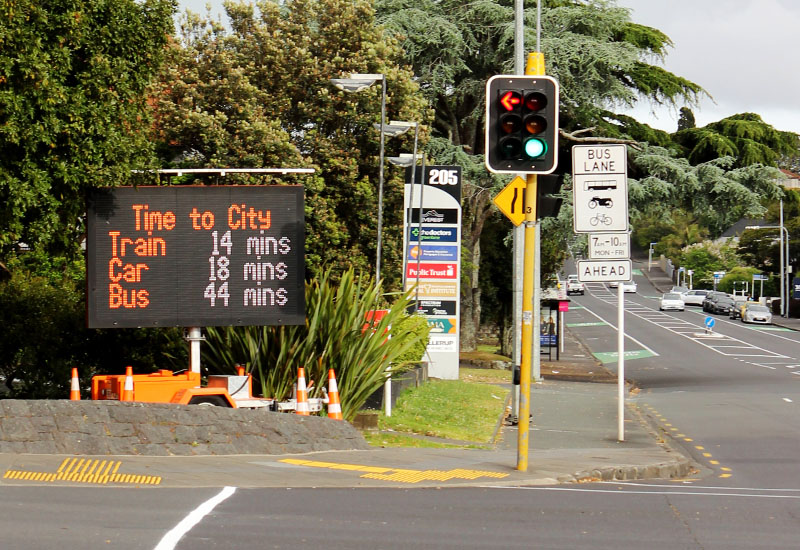
What is SmartVMS?
SmartVMS fuses traditional mobile VMS infrastructure with cutting-edge transport data intelligence. Unlike static messaging boards, SmartVMS dynamically updates to reflect real-time conditions, giving road users up-to-the-minute travel time comparisons. Whether it’s helping commuters choose the fastest transport mode or guiding motorists through construction zones, SmartVMS transforms signage from passive warnings to active journey tools.
Multi-Modal Travel Time Display
Real-time comparisons across driving, bus, and rail travel, helping commuters make informed choices at a glance.
No Additional Hardware Required
Leveraging virtual data streams, SmartVMS operates with minimal setup, significantly reducing deployment costs.
Fully Mobile & Customisable
Deployed on mobile platforms or fixed infrastructure, SmartVMS is flexible for long-term projects or rapid deployments.
SmartVMS is more than just a sign — it’s a step toward smarter, safer, and more responsive transport systems. Whether you’re managing a temporary closure or planning a city-wide modal shift, SmartVMS helps you drive real change.
SmartVMS Features
Smart Detours
Developed from insights gathered via Auckland Transport's CX program, designed to reduce uncertainty and empower end users.
Enhance Customer Experience
During disruptions, SmartVMS suggests the fastest detours based on current traffic conditions — enhancing flow and safety.
Promote Public Transport
Seen in action on Auckland’s motorway network, SmartVMS drives modal shift by clearly demonstrating time savings through public transport options.
SmartVMS Transforms East Auckland Travel with Real-Time Solutions
The project includes the implementation of advanced SmartVMS (Variable Message Signs) to provide real-time information to drivers, suggesting alternative routes to circumvent the construction zone and alleviate traffic build-up. The technology has been actively employed to address and mitigate traffic congestion, reduce the impact of construction activities on travel, and establish solid metrics for assessing system performance providing transport engineers with daily performance reviews, congestion analysis, and baseline comparisons.
Contact us for a consultation and tailored solution.